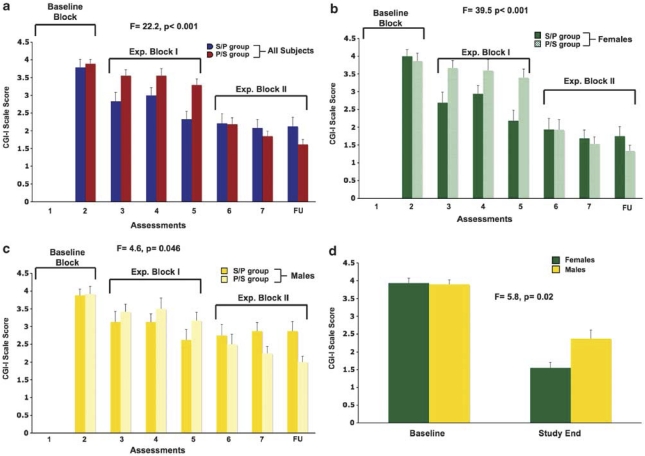
Figure 4.
Mean CGI-I scores (±SE) are shown for each of the seven assessments and the follow-up evaluation are presented for all subjects combined (a), as well as for females (b) and males (c) separately. Mean baseline and study end CGI-I scores are also shown (d) separated into female and male subgroups.

