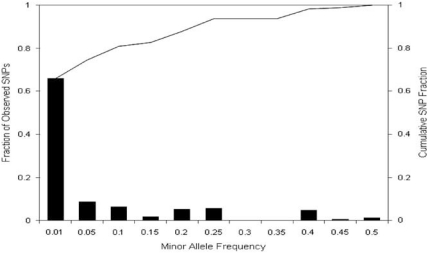
Figure 1.
Minor allele frequencies (x axis), proportion (left y axis) and cumulative fraction (right y axis) of nAChR SNPs identified through resequencing. Bars represent the percentage of SNPs within each category of minor allele frequency (MAF) with the figure under each bar being the maximum MAF within that category. The line represents the cumulative frequency of SNPs.

