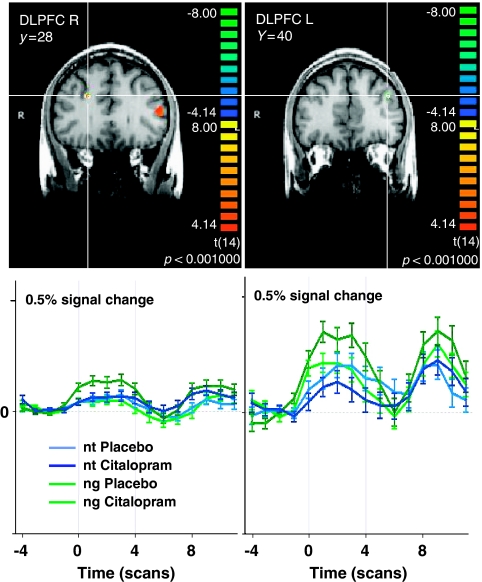
Figure 2.
Serotonergic modulation of brain activation during the anticipation of negative (ng) vs neutral (nt) pictures. Shown are significant brain regions in the comparison Citalopram >Placebo in bilateral DLPFC in coronal brain sections with below the respective averaged event-related time courses of BOLD response. Anticipation period between the gray bars are shown as in all figures, thereafter the perception of the respective picture. Significance level of the random effects analysis p<0.001, color bars representing t-values. R, right; L, left; y, Talairach coordinate indicating the position of the coronal section.

