Figure 4.
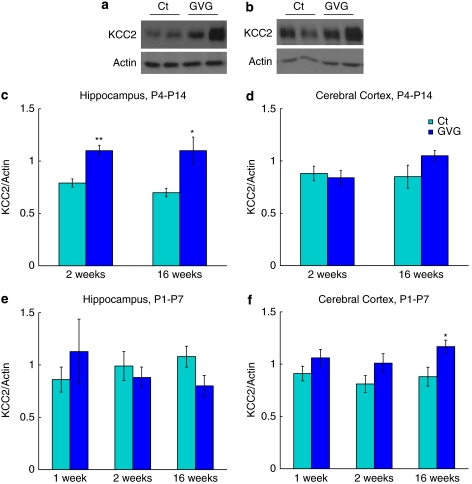
Modulation of the K+-Cl− co-transporter KCC2. Examples of KCC2 and actin in homogenates of 2-week-old mice hippocampi (a), and 16-week-old mice cerebral cortices (b) of Ct4–14 and GVG4–14 groups. KCC2 levels normalized to actin at 2 and 16-weeks in P4–14 hippocampus (c) and cerebral cortex (d). KCC2 levels normalized to actin at 1, 2, and 16 weeks in P1–7 hippocampus (e) and cerebral cortex (f). n=4–10 at each point for each group; **p<0.01; *p<0.05. Univariate analysis of variance (ANOVA) and Student's t-test were used for all analyses. Results are presented as mean±SEM. The results of each trial were normalized to the trial mean. Four to five independent repeats of each sample were averaged (each repeat includes a duplicate of each sample).

