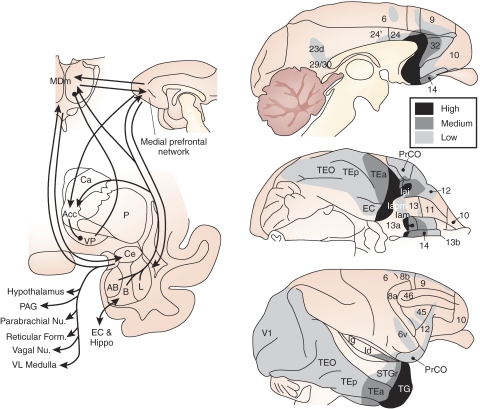
Figure 2.
Summary of amygdaloid outputs. Left: diagram of amygdaloid circuits involving the striatum pallidum medial thalamus and prefrontal cortex and output to the hypothalamus and brainstem. Right: diagram of areas of the cerebral cortex that receive axonal projections from the amygdala. The dark, medium, and lightly shaded areas represent high, medium, and low density of amygdaloid fibers. Modified from Amaral et al, 1992.

