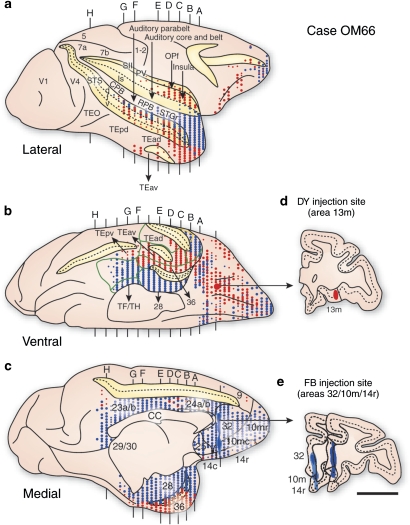
Figure 4.
A comparison of the cortico-cortical connections of the ‘orbital' and ‘medial' prefrontal networks labeled by injections of different retrograde axonal tracers in the same animal. Panels a, b, and c illustrate patterns of retrograde neuronal labeling (red and blue dots) on the lateral, ventral, and medial surfaces of the cerebral cortex, related to injections in area 13m of the orbital network (in red, panel d) and in areas 32, 10m, and 14r of the medial network (in blue, panel e). From Saleem et al, 2008.

