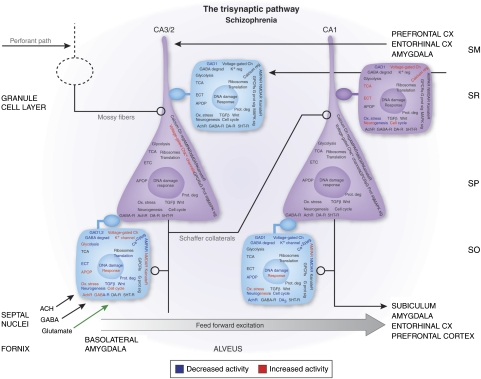
Figure 4.
A schematic diagram of pyramidal cells (triangular) and GABAergic interneurons (square) within the trisynaptic pathway of the hippocampus. The functional categories of genes evaluated for changes in expression as a group are indicated on the various neuronal cell types at each locus along the trisynaptic pathway. GABA cells in which GAD67 expression is significantly decreased are indicated with a light blue fill color in the stratum radiatum and stratum oriens (SO) of sector CA3/2 and in the SO of sector CA1. Although these latter three interneuronal subpopulations may show a decreased ability to exert inhibitory modulation of the pyramidal neurons in their sector, closer scrutiny of the various functional categories of genes indicates that the overall pattern of expression changes are quite different at each locus, suggesting that the unique connectivity found at each of these sites may have an important function in determining how neurotransmitter receptors, signaling pathways, metabolic pathways, and other complex groups of genes involved in transcription, translation, and DNA repair are regulated. See Benes et al (2007) for more details.

