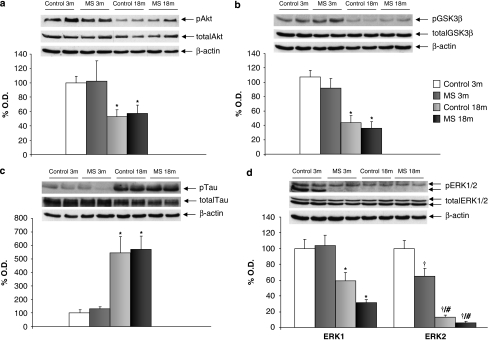
Figure 2.
Age and maternal separation (MS) interact to affect insulin levels and intracellular insulin pathways. (a) Phosphorylated Akt levels (active form of the enzyme, 60 kDa) normalized to total Akt, main effect of age (F1,41=9.606, p<0.01; n=8–12); (b) phosphorylated (inactive) GSK3β levels (46 kDa) normalized to total GSK3β, main effect of age (F1,32=33.318, p<0.001; n=6–10); (c) Phosphorylated Tau levels (40–50 kDa) normalized to total Tau, main effect of age (F1,35=25.622, p<0.001; n=8–10); (d) Phosphorylated (active) ERK1 (44 kDa) normalized to total ERK1, main effect of age (F1,33=20.429, p<0.001; n=6–10) and phosphorylated (active) ERK2 levels (42 kDa) normalized to total ERK2, interaction (rearing × age) (F1,35=6.054, p<0.05). Figure shows percentage of optical density (O.D.) values of control young rats and representative picture of the blotting. No differences were found in the non-phosphorylated (total) levels of the enzymes. 3 m: 3 months, young rats; and 18 m: 18 months, aged rats. *p<0.01 or better, main effect of age. †p<0.05 or better vs control young rats, #p<0.05 vs MS young rats.

