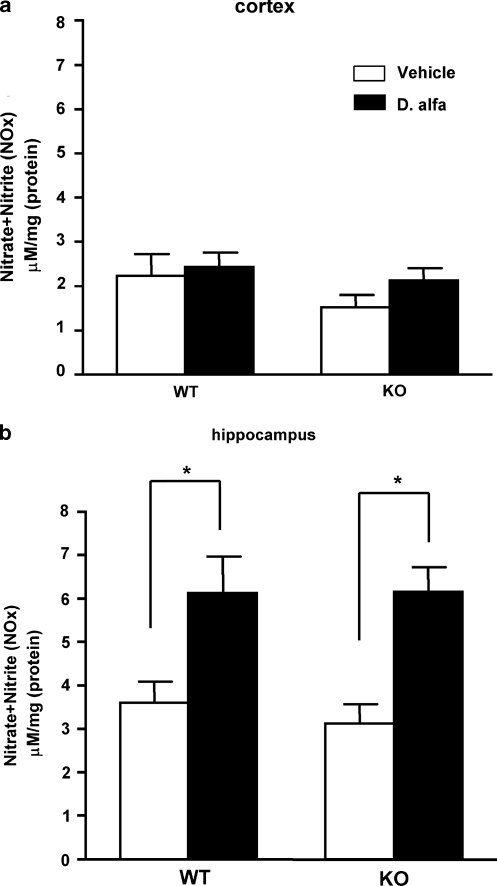
Figure 3.
Nitrate and nitrite (NOx) levels in brain tissue from wild-type (WT) and STOP null mice (KO) that received either D. alfa (25 μg/kg, i.p.) or vehicle (10 ml/kg, i.p.). (a) NOx levels in cortex. (b) NOx levels in hippocampus. NOx levels [μM/mg (protein)] are shown in the bar graph as mean±SEM. NOx levels in hippocampus were increased in both WT and KO mice 3–4 h after D. alfa treatment. White bars, vehicle (10 ml/kg; WT: N=8, KO: N=8); black bars, D. alfa (25 μg/kg i.p.; WT: N=10, KO: N=8). Two-way ANOVA with Bonferroni post hoc t-test, *p<0.05.

