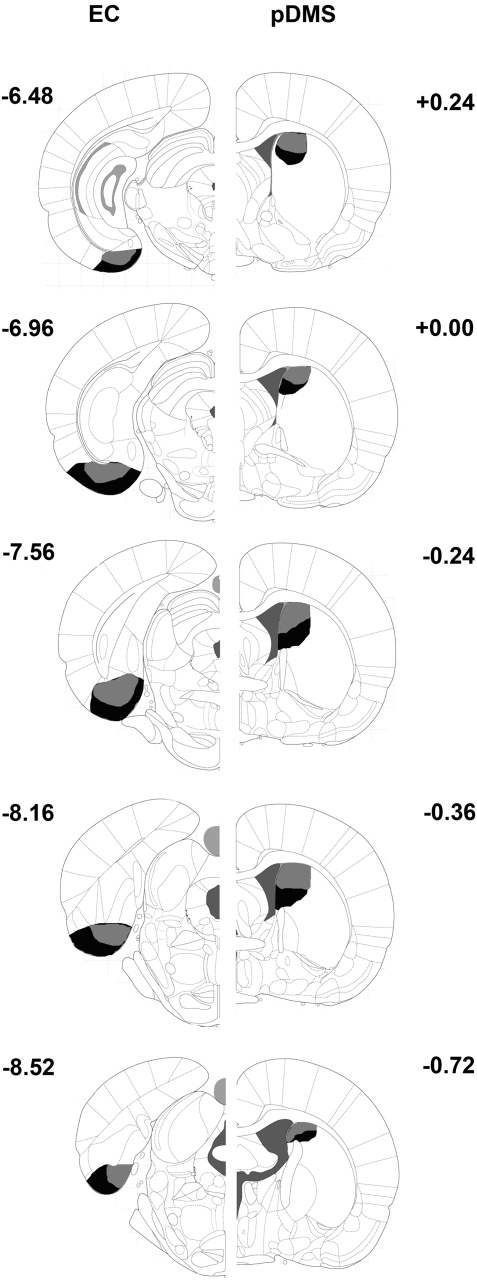
Figure 1.
Schematic representations of the extent of neuronal damage in the EC (left hemisphere) and the areas devoid of TH immunoreactivity in the pDMS (right hemisphere) across all lesion groups. Animals received disconnection lesions using NMDA infusion into the ipsilateral EC, 6-OHDA infusion into the contralateral pDMS, unilateral NMDA infusions into the EC, or unilateral 6-OHDA into the pDMS. Gray areas represent the smallest extent and black areas the largest extent of lesions. Numbers indicate distance from bregma in mm.

