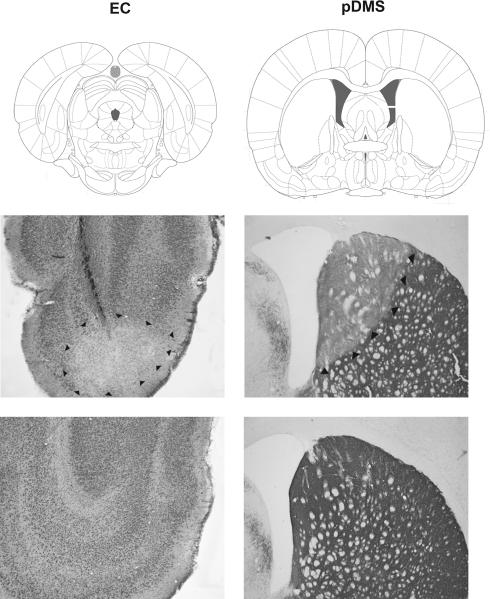
Figure 2.
Representative photomicrographs of an NMDA-induced cell body lesion of the EC and a 6-OHDA-induced loss of tyrosine-immunoreactive fibers in the pDMS. The panels on the left side show an EC lesion (middle) and an EC sham lesion (bottom), and the panels on the right side show a pDMS DA depletion (middle) and a pDMS sham lesion (bottom). The boxed regions in the top panel are shown at high magnification in the middle and bottom panels. Plates are adaptations from the atlas of Paxinos and Watson (2007); scales are relative to bregma.

