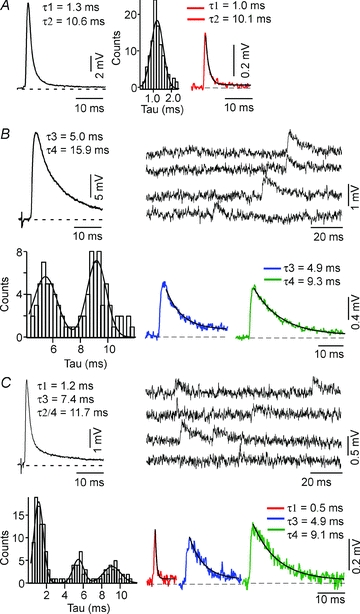
Figure 7. CRN mEPSPs are not composites.

A, B and C, comparison of decay kinetics of evoked and mEPSPs, for class 1, class 2 and class 6 connections, respectively. In each example, averaged evoked EPSPs (left panel, A and upper left panels, B and C) have multiple exponential decays as indicated by τ values. The corresponding mEPSP decay time histograms (centre, A and lower left panels, B and C) are fitted as the sums of one, two or three Gaussians, respectively. In right panel, A, and lower right panels, B and C, are averaged mEPSPs for traces selected from each mode. In the upper right panels, B and C, are continuous recordings with mEPSPs of varying decay kinetics. A, class 1 EPSP decay is fitted by two exponentials, with τ1 = 1.3 and τ2 = 10.6 ms. The histogram of mEPSP decay times is fitted as one Gaussian. The decay times of the corresponding averaged mEPSP are τ1 = 1.0 and τ2 = 10.1 ms. B, class 2 EPSP decay is fitted with two exponentials τ3 = 5.0 and τ4 = 15.9 ms. The histogram of mEPSP decay times is fitted as the sum of two Gaussians. The decay times of the corresponding averaged mEPSPs are τ3 = 4.9 and τ4 = 9.3 ms. C, class 6 EPSP decay is fitted by three exponentials τ1 = 1.2, τ3 = 7.4 and τ2/τ4 = 11.7 ms. The histogram of mEPSP decay times is fitted as the sum of three Gaussians. The decay times of the corresponding averaged mEPSPs are τ1 = 0.5, τ3 = 4.9 and τ4 = 9.1 ms.
