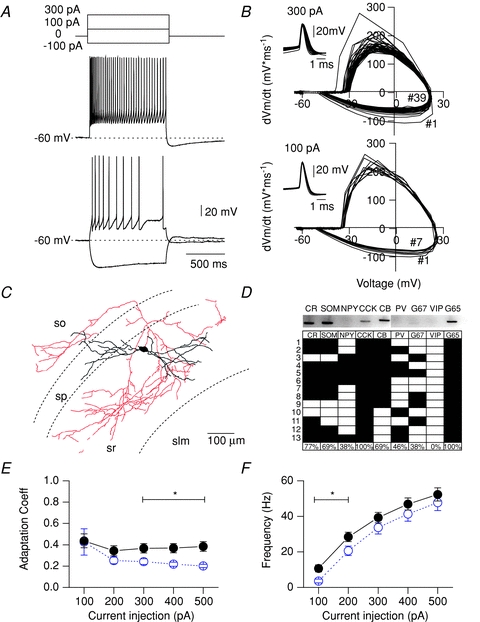
Figure 1. Electrophysiological and neurochemical properties of CCK-SCAs.

A, electrophysiological properties of CCK-SCAs indicated by firing phenotype. Dotted lines indicate a Vm of –60 mV. B, phase plot corresponding to 100 and 300 pA representative traces and APs waveform collected in insets C, representative morphology of the CCK-SCAs population. D, representative scRT-PCR gel and neurochemical profile of a subgroup of CCK-SCAs (n= 13). E, adaptation coefficient (first inter-spike interval (ISI) divided by the average of the last two ISIs for CCK-SCAs (black circles) and CCK-BCs (blue open circles; data replotted from Cea-Del Rio et al. 2010), and (F) input–output relationship for CCK-SCAs (black circles) and CCK-BCs (blue open circles; data replotted from Cea-Del Rio et al. 2010).
