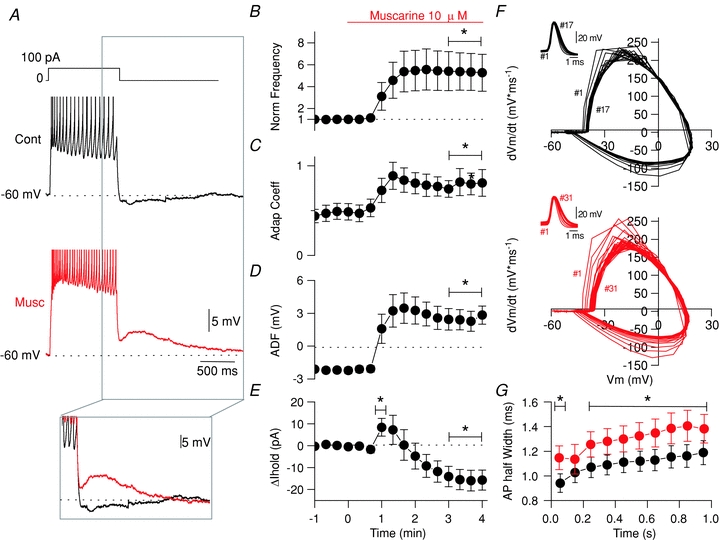
Figure 3. Cholinergic modulation of CCK-SCAs electrophysiological properties.

A, voltage response from –60 mV in control (black) and after bath application of 10 μm muscarine (red) for CCK-SCAs. B, AP frequency normalized to the first minute. C, adaptation coefficient normalized to the first minute. D, afterdeflection (ADF) in a 200 ms window 200 ms after the current offset. E, ΔIhold change relative to –60 mV holding potential. F, representative phase plots of dV/dt versus voltage of APs for CCK-SCAs in control conditions (black) and after bath application of 10 μm muscarine (red). G, AP half width, binned in 100 ms intervals during the 1 s current step for a population of 21 CCK-SCAs in control conditions (black) and after bath application of 10 μm muscarine (red).
