
Figure 4. M1 and M3 muscarine receptors mediate the cholinergic phenotype of CCK-SCAs.
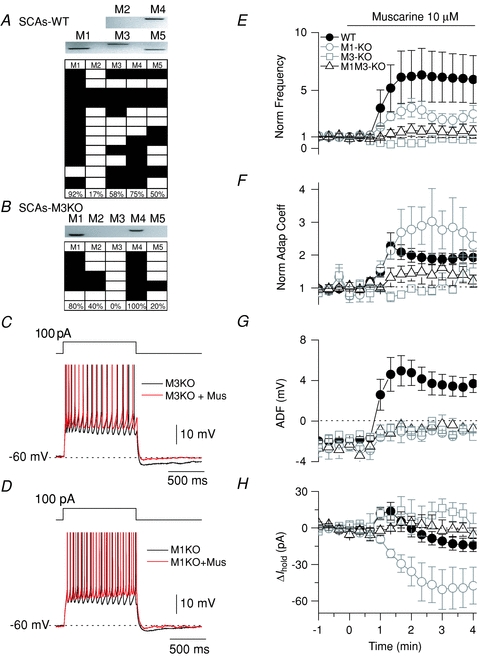
A, representative scRT-PCR gel and mAChR profile for CCK-SCAs. B, scRT-PCR gel and mAChR profile for M3 KO CCK-SCAs. Representative traces for mAChR-induced changes in M3 KO CCK-SCAs (C) and M1 KO CCK-SCAs (D). E, normalized frequency summary population plot for control CCK-SCA (filled circles), M1 KO CCK-SCAs (open circles), M3 KO CCK-SCAs (open squares) and M1M3 KO CCK-SCAs (open triangles). F, normalized adaptation coefficient plot for control CCK-SCAs (filled circles), M1 KO CCK-SCAs (open circles), M3 KO CCK-SCAs (open squares) and M1M3 KO CCK-SCAs (open triangles). G, ADF summary population plot for control CCK-SCAs (filled circles), M1 KO CCK-SCAs (open circles), M3 KO CCK-SCAs (open squares) and M1M3 KO CCK-SCAs (open triangles). H, change in holding current for control CCK-SCAs (filled circles), M1 KO CCK-SCAs (open circles), M3 KO CCK-SCAs (open squares) and M1M3 KO CCK-SCAs (open triangles).