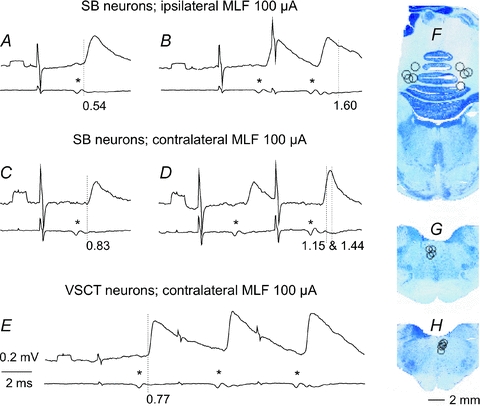
Figure 1. Examples of monosynaptic actions evoked from the MLF in SB and VSCT neurons.

In each pair of records upper traces are representative averaged intracellular records (n= 10–40) from 2 SB neurones (A and B, C and D) and from 1 VSCT neurone (E), while lower traces are records of descending volleys from the surface of the spinal cord. A and B, after contralateral hemisection. C–E, after ipsilateral hemisection. Asterisks indicate the first component of the MLF volleys. Dotted lines in A, C and E mark the onset of monosynaptic EPSPs evoked by these volleys while dotted lines in B and D mark the onset of disynaptic PSPs following them. Note that the second monosynaptic EPSP in B is followed by disynaptic EPSPs (as indicated by a hump in its declining phase) and that the second monosynaptic EPSP in D is followed by both disynaptic EPSP during its rising phase and disynaptic IPSP starting just after its peak. Latencies of these PSPs as from the volleys (segmental latencies) are given below the records. Rectangular pulses at the beginning of the records are 0.2 mV calibration pulses. Time calibration (2 ms) is for all records. In this and the following figures the negativity is downwards in intracellular records and upwards in cord dorsum records. F, G and H, reconstruction of stimulation sites in the cerebellum and in the ipsilateral and contralateral MLF, respectively. The circles indicate locations of electrolytic lesions made to mark stimulation sites in the cerebellum in 8 experiments and in the MLF in 9 experiments. They are indicated on the transverse sections from one of these experiments with respect to the midline and the location of the nucleus interpositus in F and the midline and the dorsal border of the medulla in G and H.
