
Figure 3. The relative expression of Kv4.3 and Cav3.1 mRNAs correlates with the relative balance between IA and IT.
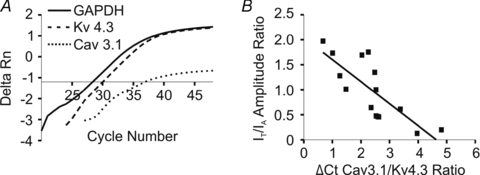
A, representative example of real-time PCR amplifications from a single PVN-RVLM neuron from a sham rat, in which the A-type channel subunit Kv4.3 (dashed line) and the T-type channel subunit Cav3.1 (dotted line) mRNAs were tested against the reference gene, GAPDH (continuous line). The cycle numbers that the respective lines crossed the x-axis are their threshold values (Ct). Note that Cav3.1 mRNA crossed the x-axis at a later cycle number than did Kv4.3, indicating less Cav3.1 mRNA expression compared to Kv4.3. B, summary of the relative expression of Cav3.1/Kv4.3 single-cell mRNA compared to the IT/IA amplitude ratio measured at –20 mV. Note that the ΔCt value is used in the plot. Thus, the less Cav3.1 relative to Kv4.3 mRNA expressed, the larger the ΔCt Cav3.1/Kv4.3 ratio will be. A significant correlation between current amplitude and mRNA expression ratios was observed (r2= 0.61, P < 0.001). For this analysis, neurons from both sham and hypertensive rats were used.