
Figure 4. Correlation of SR Ca2+ release rate and total glycogen concentration in biopsies from cross-country skiers obtained 4 h post exercise.
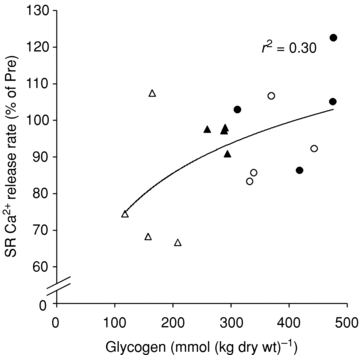
Data points are included from the legs (circles) and arms (triangles) from both CHO (filled symbols) and water (open symbols) trials. The line indicates best fit of all the data points (r2= 0.30, P= 0.03, n= 16).