
Figure 5. Correlation of TEM-determined subfractions of glycogen and SR Ca2+ release rate.
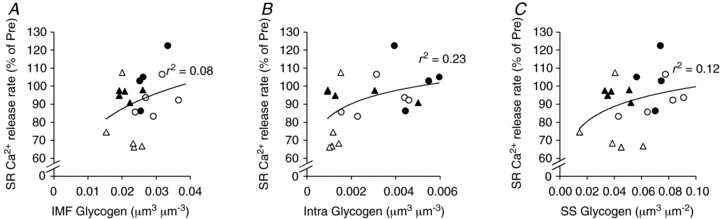
A, IMF glycogen; B, Intra glycogen; C, SS glycogen. Data points are included from the legs (circles) and arms (triangles) from both CHO (filled symbols) and water (open symbols) trials. Lines indicate best fits of all the data points (A: r2= 0.08, P= 0.23, n= 19; B: r2= 0.23, P= 0.04, n= 19; C, r2= 0.12, P= 0.14, n= 19).