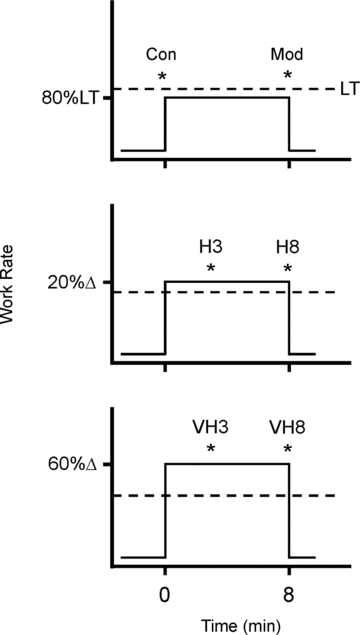
Figure 1. A schematic showing the exercise protocols for measurement of peak isokinetic torque (and power) over time during exercise at 80% LT (Mod), 20%Δ (H) and 60%Δ (VH).

Maximal efforts for 5 crank revolutions were performed at time points represented by *. Velocity-specific peak power was measured at each of three target pedalling cadences (60, 90 and 120 rpm) with each test completed on a different day and in a randomized order. This required a total of 18 laboratory visits for each participant.  was measured breath-by-breath throughout each test.
