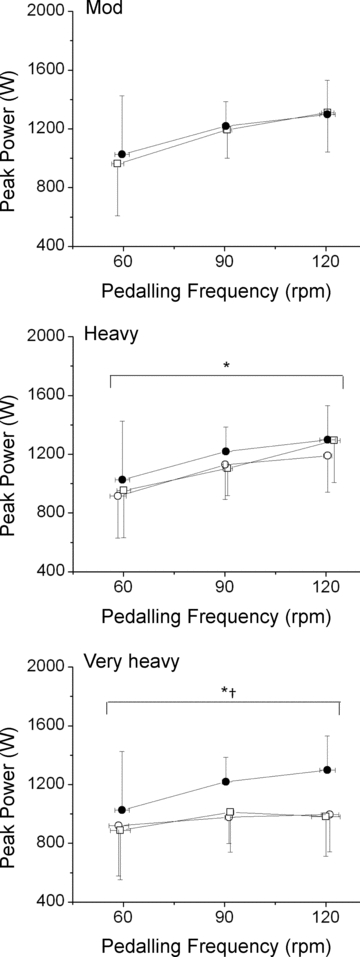
Figure 3. Velocity-specific peak power developed during a maximal isokinetic effort, plotted as a function of pedalling frequency.

Panels: Mod:•, Con; □, Mod. Heavy:•, Con; ○, H3; □, H8. Very Heavy: •, Con; ○, VH3; □, VH8. *Significant (P < 0.05) main effect of time; power during H3/VH3 and H8/VH8 significantly (P < 0.05) lower than Con. †Significant (P < 0.05) interaction (time × pedalling frequency) was present. Error bars are s.d.
