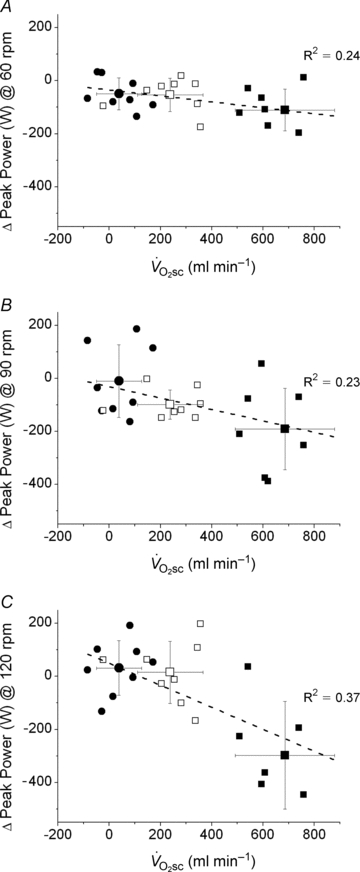
Figure 5. Reduction in velocity-specific peak power (indicative of muscle fatigue) from Con to end exercise, plotted as a function of the during CWR exercise.

A, 60 rpm; B, 90 rpm; C, 120 rpm. •, Mod; □, H8; ▪, VH8. Error bars are s.d.
