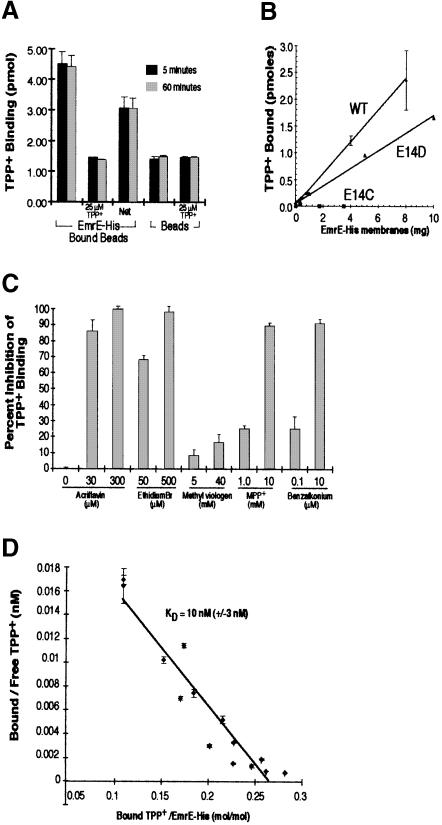
Fig. 2. Purified EmrE–His specifically binds [3H]TPP+. (A) Purified EmrE–His (4 μg) was bound to Ni–NTA beads and then incubated with 25 nM [3H]TPP+ in NH4–DM buffer. TPP+ binding reactions were incubated for 5 min (black bars) or 60 min (gray bars). Identical binding reactions were performed with beads that had not been bound with EmrE–His. Each TPP+ binding reaction was performed in the presence or absence of 25 μM cold TPP+. (B) Bacterial membranes expressing EmrE–His wild type, E14D or E14C were detergent solubilized and then incubated with Ni–NTA beads. Increasing amounts of solubilized membranes were bound to 20 μl of beads. The beads were then washed to remove proteins that did not bind. The bound beads were then incubated for 30 min with 25 nM [3H]TPP+ and the amount of bound TPP+ was determined as described above. (C) EmrE–beads were incubated with 50 nM [3H]TPP+ in the presence of various EmrE substrates. The concentration of inhibitor used is indicated below each bar. The values of TPP+ binding are plotted in terms of percentage inhibition, with binding in the absence of inhibitors representing zero inhibition. (D) EmrE–His transporter (0.35 μg) bound to Ni–NTA beads was incubated with TPP+ over a range of TPP+ concentrations (10–300 nM). Bound TPP+ was determined by measuring the EmrE–His-associated radioactivity after isolating the beads from the supernatant, and free TPP+ concentrations were measured by subtracting bound radioactivity from the total radioactivity present in each binding reaction. The KD was determined from the reciprocal of the slope obtained from the Scatchard plot. The KD for TPP+ under these conditions was 10 nM (±3 nM). In (A–D), all results are generated from the average of triplicate reactions and the error bars represent the average deviation.

An official website of the United States government
Here's how you know
Official websites use .gov
A
.gov website belongs to an official
government organization in the United States.
Secure .gov websites use HTTPS
A lock (
) or https:// means you've safely
connected to the .gov website. Share sensitive
information only on official, secure websites.
