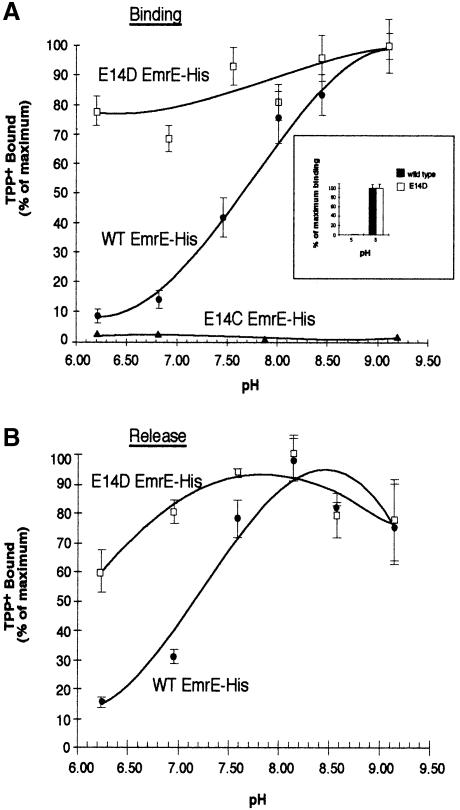
Fig. 3. Effect of pH on the binding and release of TPP+ to EmrE–His wild type and the E14 replacement mutants. (A) EmrE–beads were incubated with 25 nM [3H]TPP+ for 1 h in solutions over a range of pH values. Values are graphed as a percentage of maximal TPP+ binding. Purified wild-type EmrE–His (•) and E14D EmrE–His mutant (□) or E14C EmrE–His membranes (▴) were assayed for TPP+ binding over a range of pH values. The inset graph shows TPP+ binding at pH 5 and 8. For this experiment, TPP+ bound to EmrE–His was separated from free TPP+ using size exclusion chromatography over a Sephadex G–50 column. After the TPP+ binding to EmrE–His at the desired pH, the binding reaction was run over the column and the bound [3H]TPP+ collected in scintillation vials by centrifugation and then counted. The black bars represent the data from wild-type EmrE–His and the open bars represent data from the E14D EmrE–His mutant construct. (B) EmrE–beads were incubated with 25 nM TPP+ for 30 min at 4°C. EmrE–beads bound to TPP+ at equilibrium levels were diluted 1:75 in 60 mM buffered solutions at the desired pH and incubated at 4°C for 2 h. This time was determined to be sufficient for binding reactions to reach equilibrium in experiments not shown here. Values are graphed as a percentage of maximal TPP+ binding. Wild-type EmrE–His (•) and the EmrE–His E14D mutant (□) were assayed. For (A) and (B), each point represents the average of triplicate binding reactions. The error bars represent the average deviation of the triplicate measurements.

An official website of the United States government
Here's how you know
Official websites use .gov
A
.gov website belongs to an official
government organization in the United States.
Secure .gov websites use HTTPS
A lock (
) or https:// means you've safely
connected to the .gov website. Share sensitive
information only on official, secure websites.
