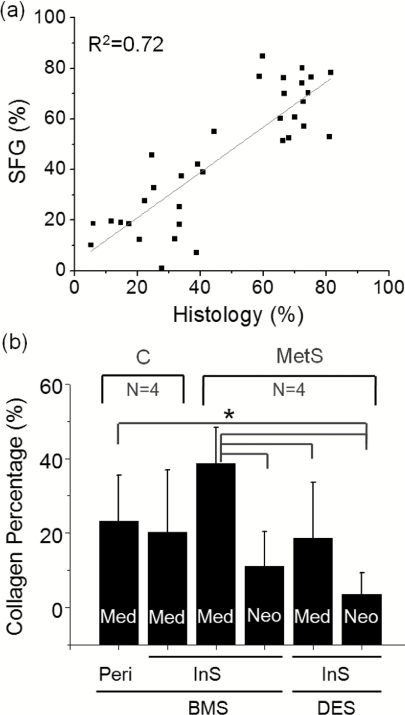
Figure 5.
Quantitative analysis of collagen according to the SFG signal in stented arteries. (a) Correlation of collagen percentage between the SFG and histological evaluations (R2 = 0.72). (b) Comparison of collagen percentages among different locations of different groups with different stents. C: control group; MetS: metabolic syndrome group; BMS: Bare metal stent of 1.0 expansion ratio; DES: Taxus drug-eluting stent of 1.0 expansion ratio; Peri: peristent sample; InS: in-stent sample; Med: media; Neo: neointimal hyperplasia. The asterisk and bars indicate the significant differences between specific groups (P < 0.05).

