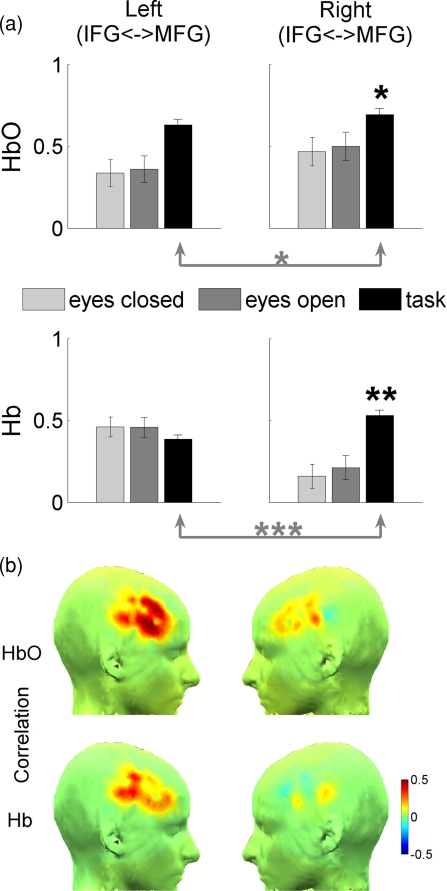
Figure 3.
Changes in unilateral (intrahemispheric) functional connectivity during the task. (a) Group average correlations between HbO signals and Hb signals averaged over the corresponding groups of channels∕voxels pairwise during baseline periods (with eyes closed and open) as well as during the cognitive task. IFG and MFG are the inferior and the middle frontal gyrus, respectively. Significant changes are indicated by black asterisks (compared to baseline) and gray asterisks (left versus right hemispheres); p < 0.05 (*), p < 0.01 (**), and p < 0.001 (***). (b) Unilateral “connectivity maps” averaged over all subjects (see text for explanation how connectivity maps were created).

