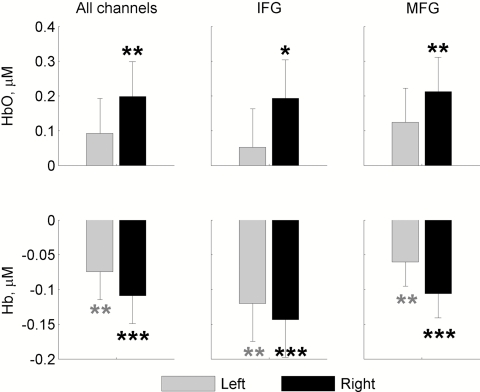
Figure 8.
Group average hemodynamic amplitude responses. Changes in concentrations of HbO and Hb are averaged over a 30-s time period of the task and compared to baseline (1-s time period immediately preceding the onset of the task) for the left and right hemispheres. IFG and MFG are the inferior and the middle frontal gyrus, respectively. Significant changes are indicated by asterisks; p < 0.05 (*), p < 0.01 (**), and p < 0.001 (***).

