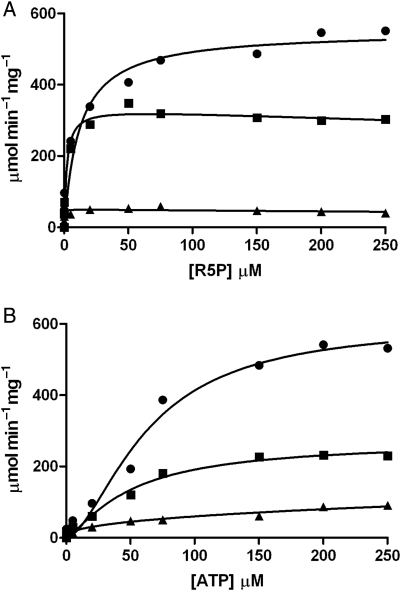
Fig. 5.
Enzyme activity of Mt-PrsA and kinetic characterization of R5P (A) and ATP (B) using a continuous enzyme-coupled spectrophotometric assay. (A) A plot of velocity (ν) of Mt-PrsA to increasing [R5P] in the presence of 50 mM Pi (filled circles), 5 mM Pi (filled squares) and no Pi (filled triangle). Data for 50 mM Pi fitted to Eq. (2), and data obtained for 5 mM Pi and no Pi were fitted to Eq. (3). (B) A plot of velocity (ν) of Mt-PrsA to increasing [ATP] in the presence of 50 mM Pi (filled circles), 5 mM Pi (filled squares) and no Pi (filled triangle), all of which were fitted to Eq. (4) using nonlinear regression analysis. All data points plotted (calculated mean) represent experiments performed in triplicate using three independent preparations of recombinant Mt-PrsA. Calculated standard errors (±SE) for kinetic constants are reported in the manuscript where appropriate.

