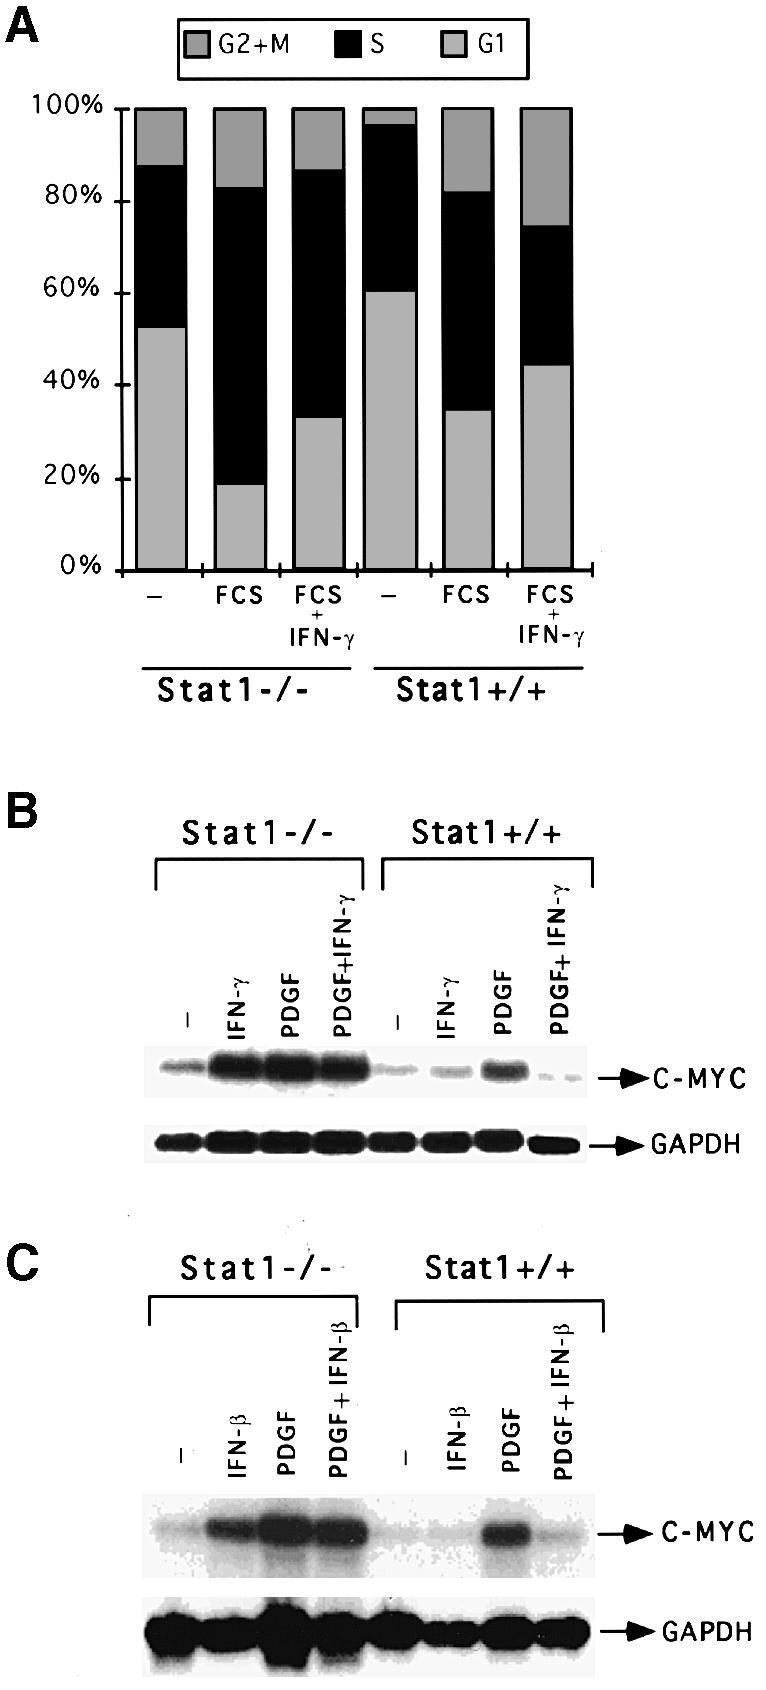
Fig. 2. Effects of growth factor and IFN treatment on c–myc regulation. (A) MEFs were grown to 20% confluence in DMEM with 10% FCS. The cells were serum-starved in DMEM with 0.1% FCS for 48 h. Cells were either untreated (–) or treated with 10% FCS, alone (FCS) or with 1000 IU/ml of murine IFN–γ (FCS+IFN–γ). Twenty-four hours later, the cells were stained with propidium iodide and the DNA content was analyzed by flow cytometry. The percentage of cells in the G1, S and G2+M parts of the cell cycle are indicated in each histogram. (B) Stat1-null or wild-type MEFs were either untreated or treated for 30 min with 1000 IU/ml of IFN–γ alone, 200 ng/ml of PDGF alone, or PDGF plus IFN–γ. Northern transfers were hybridized with c–myc or GAPDH probes. (C) Stat1-null or wild-type MEFs were either untreated or treated for 30 min with 1000 IU/ml of IFN–β alone, 200 ng/ml of PDGF alone, or PDGF plus IFN–β. Northern transfers were hybridized with c–myc or GAPDH probes.
