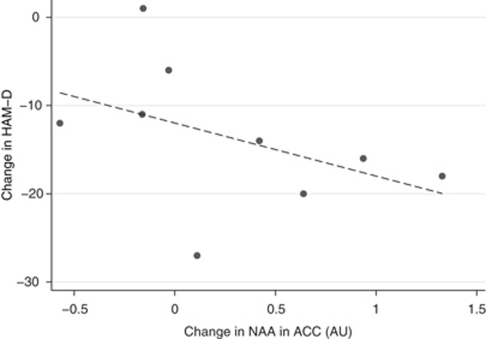
Figure 6.
Scatter plot for change in N-acetylaspartate (NAA) in the anterior cingulate cortex (ACC) vs change in Hamilton Depression Rating Scale (HAM-D) from baseline to week 6 of riluzole treatment. Change in NAA is represented in arbitrary units (AU). It must be noted that this figure has one less data point than does Figure 7 because of technically unevaluable data in the ACC for one subject.

