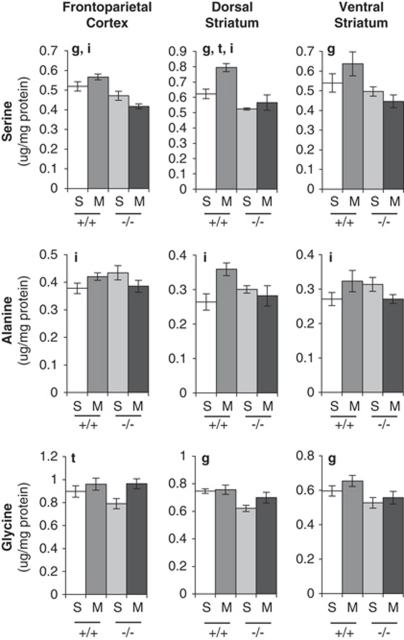
Figure 6.
Graphical representation of the effect of the null mutation of FosB on basal and methamphetamine (METH)-induced changes in tissue serine, alanine and glycine content. Analyses were carried out immediately after the final locomotor measurement detailed in Figure 5a. S, saline treated; M, METH treated. Data are presented as mean±SEM; n=5–6 per group. Letters above the bars indicate significant effects (p<0.05) of genotype (g), treatment (t), and/or genotype–treatment interaction (i) by a two-way analysis of variance (ANOVA) with the intersubject factors of genotype and treatment.

