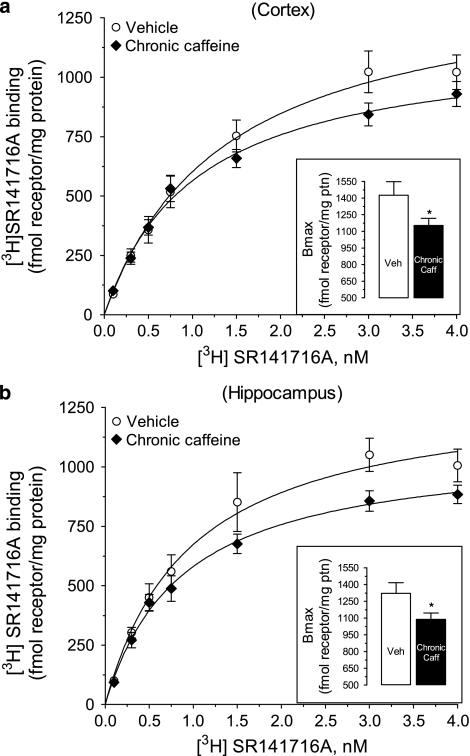
Figure 10.
Saturation analysis of specific [3H]SR141716A binding (0.1–4 nM) to (a) cortical and (b) hippocampal membranes (50 μg protein) from chronic caffeine- (3 mg/kg/day, for 22 days) and vehicle-treated mice. Insets: Bmax values, obtained from nonlinear regression analysis. Nonspecific binding was determined at all [3H]SR141716A concentrations by the addition of 1 μM AM251. All points represent mean±standard error of mean (SEM) of 5–10 experiments, each performed in duplicate. *p<0.05, vs control, calculated using the extra sum-of-squares F test.

