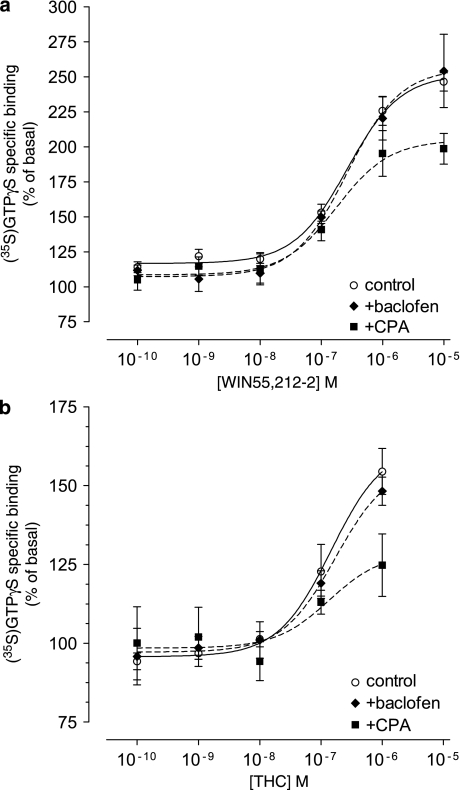
Figure 4.
Influence of A1 or GABAB receptor activation on CB1-induced stimulation of G proteins, as assayed by WIN55,212-2 or Δ9-tetrahydrocannabinol (THC)-induced [35S]GTPγS binding. Rat hippocampal membranes (10 μg protein) were incubated for 30 min at 37 °C with 30 μM GDP, 0.1 nM [35S]GTPγS, and varying concentrations of (a) WIN55,212-2 (0.1 nM–10 μM) or (b) THC (0.1 nM–1 μM), alone (○) or in combination with 100 nM CPA (▪), or 100 μM baclofen (♦). Emax and log EC50 values are shown in Table 1. Data represent mean percentage of basal stimulation±SEM of n=7 (○) and n=4 (▪, ♦), performed in duplicate. Non-visible error bars are within symbols.

