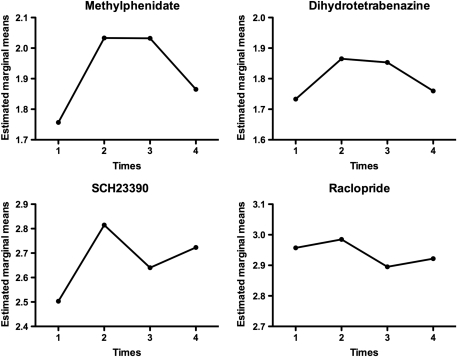
Figure 2.
Graphs showing the estimated marginal means obtained from the statistical analysis for the striatum with all four tracers. The x axis shows the four times considered in the analysis: 1=baseline pre-ECT, 2=1–2 days, 3=8–10 days, and 4=6 weeks post-ECT. Note the inverted U shape for MP and DTBZ.

