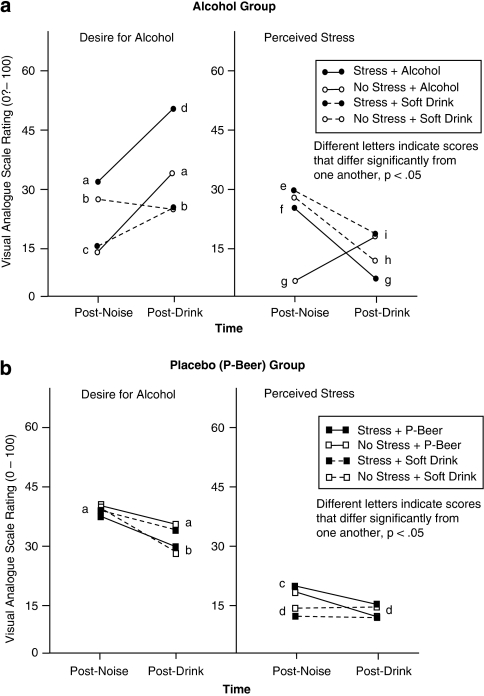
Figure 3.
Visual analog scale (VAS; 0–100: none-extreme) ratings of Desire for Alcohol and perceived Stress at post-noise task and post-drink/post-modified Stop Signal Task. (a) Scores for subjects (n=18) who received alcohol (solid lines) vs soft drink (dashed lines) combined with the active stressor (filled circles) or non-stress control task (clear circles) are shown. (b) Scores for subjects (n=20) who received alcohol-free placebo beer (P-Beer; solid lines) or soft drink (dashed lines) combined with the active stressor (filled squares) or non-stress control task (clear squares) are shown.

