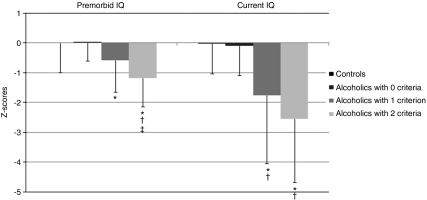
Figure 3.
Premorbid and current IQ in the control group and the three subgroups of alcoholics (mean ± SD). *Significant difference compared with controls (p<0.05). †Significant difference compared with alcoholics who did not meet any criteria (p<0.05). ‡Significant difference compared with alcoholics at risk of WE (one criterion, p<0.05).

