Figure 2.

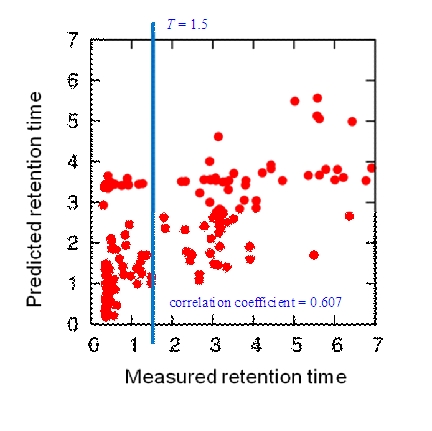
Prediction performance of SVR. The figure shows correlation between the measured retention time and predicted retention time when SVR is used for all range of the retention time. The blue line indicates the threshold T.

Prediction performance of SVR. The figure shows correlation between the measured retention time and predicted retention time when SVR is used for all range of the retention time. The blue line indicates the threshold T.