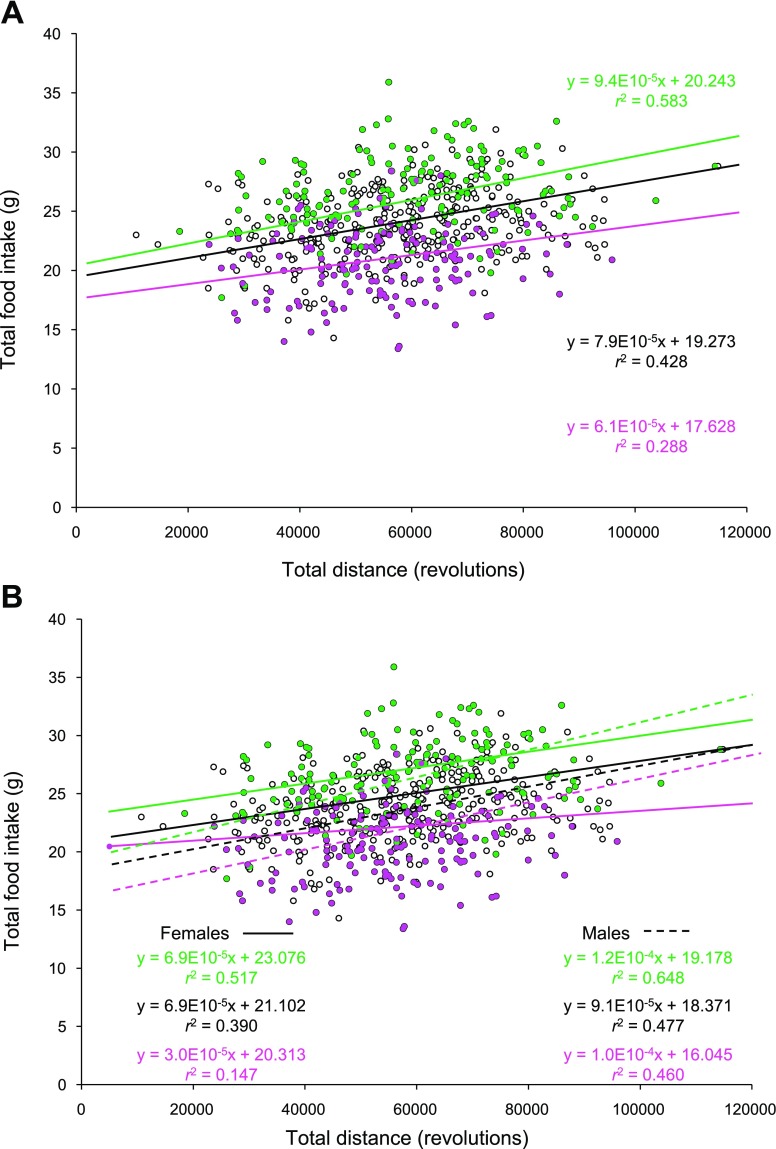
Fig. 2.
A: regression analyses between total food consumption and total running distance during the 6-day wheel exposure for the entire population (black), the 25% leanest Pre wheel access (green), and the 25% fattest Pre wheel access (pink). B: sex-specific results; the dashed regression lines characterize the females in each of 3 subpopulations, while the solid lines represent the males. Conditional slopes and r2 were controlled for sex, parent of origin, and mean fat and lean mass [(Pre exercise + Post exercise)/2]. Running wheel circumference was 1.1 m.

