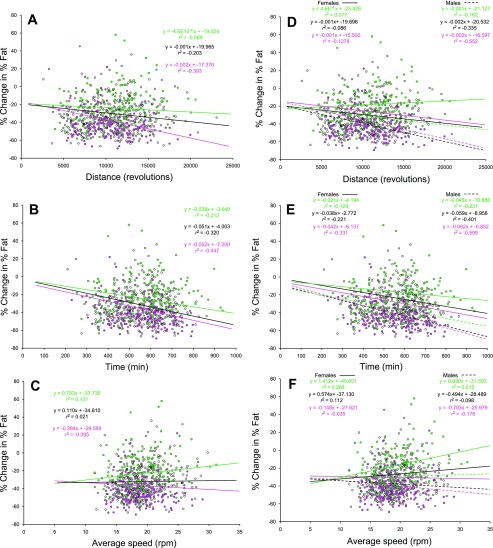
Fig. 4.
Regression analyses between % change [(Post − Pre)/Pre] × 100 in % fat mass and mean running traits on days 5 and 6 of a 6-day test. Running distance (revolutions/day), duration (i.e., cumulative 1-min intervals in which at least 1 revolution was recorded), and average speed (total revolutions/time spent running) for the entire population (black), the leanest 25% (green), and the fattest 25% (pink) are shown. In A–C the sexes are pooled in each of the 3 groups, while in D–F the regression results are sex specific (dashed line denotes females, solid line denotes males). Conditional slopes and r2 were controlled for sex, parent of origin, and food consumption. Individuals with a positive % change in % mass increased adiposity as a result of 6 days of wheel access. Running wheel circumference was 1.1 m.

