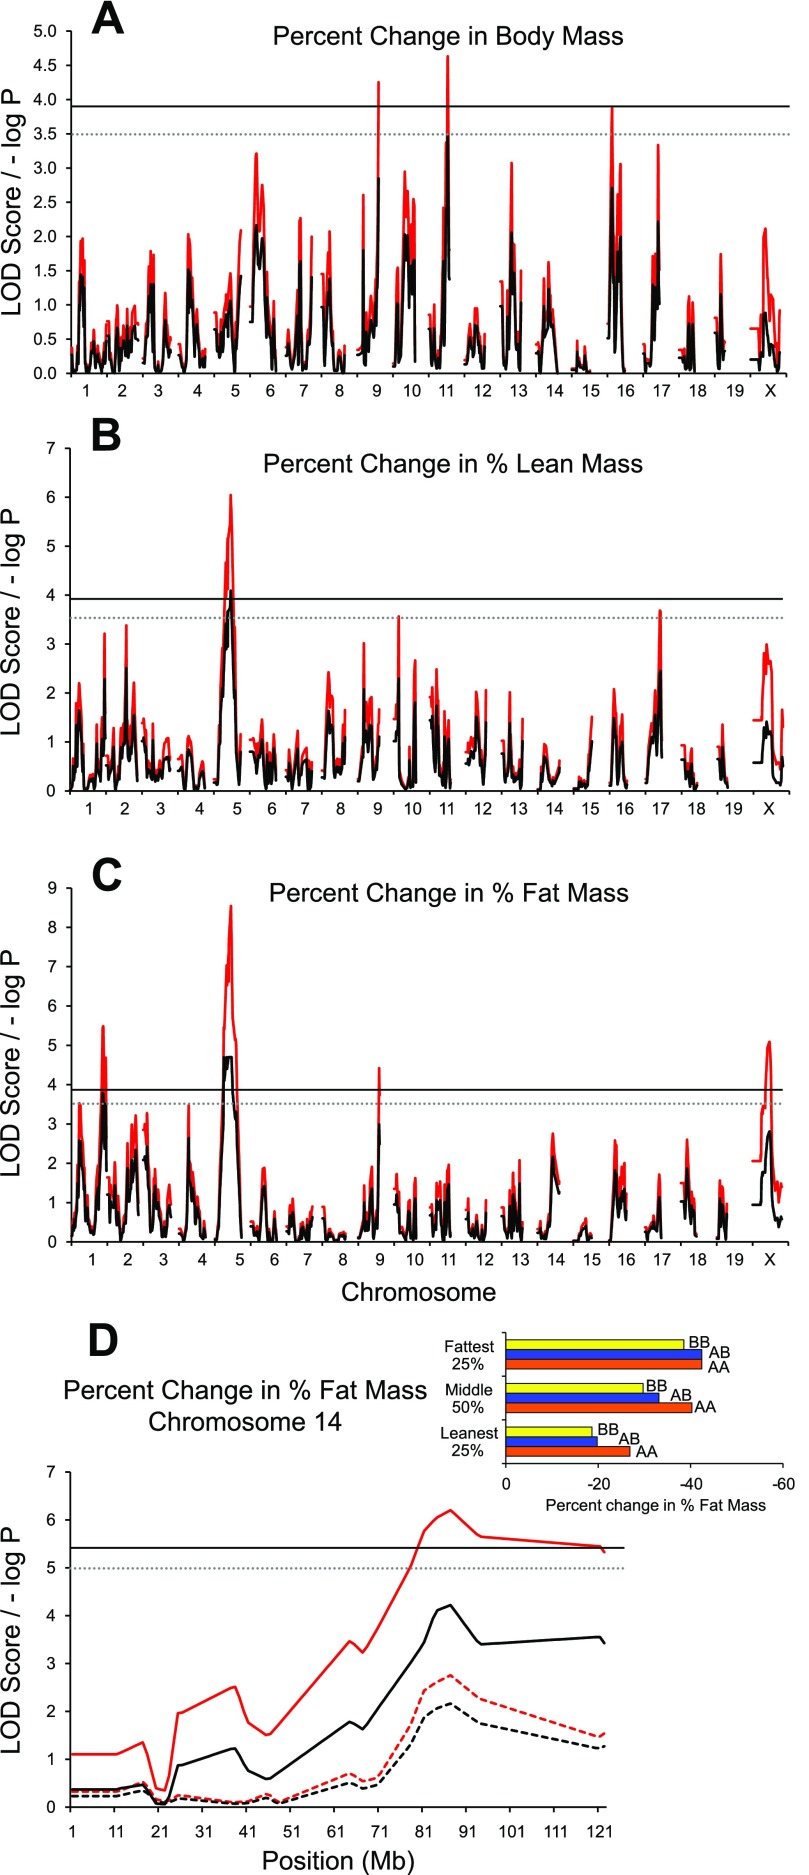
Fig. 5.
G4 quantitative trait locus (QTL) maps of % change [(Post − Pre)/Pre] × 100 in body composition following exercise. A: body mass. B: % lean mass. C: % fat mass as a result of 6 days of running wheel exposure. Red traces are the simple mapping output, and black traces are Genome Reshuffling for Advanced Intercross Permutation (GRAIP) permutation output. The solid and dotted lines represent the permuted 95% [logarithm of odds (LOD) ≥ 3.9, P ≤ 0.05] and 90% (LOD ≥ 3.5, P ≤ 0.1) LOD thresholds, respectively. D: follow-up analysis of results illustrated in C, depicting a QTL × group (Pre exercise; leanest 25%, middle 50%, fattest 25%) interaction. Dashed lines represent analysis without interaction term in the model.

