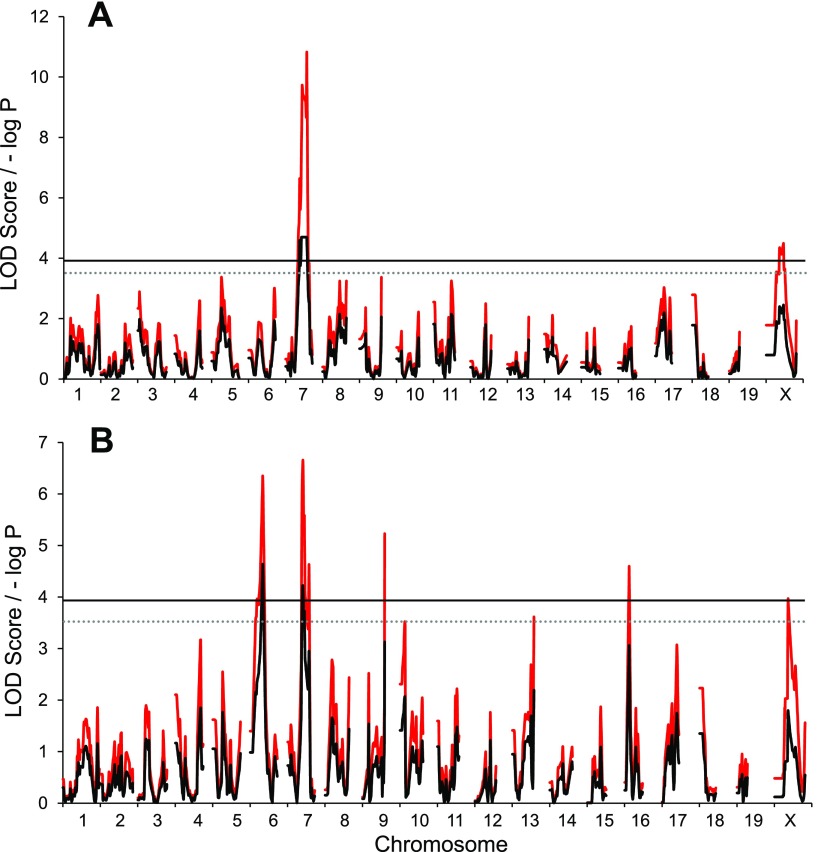
Fig. 6.
G4 QTL map of food consumption independent of body mass (A) and per gram of body mass (B) for the entire 6-day wheel access period. Red traces are the simple mapping output, and black traces are GRAIP permutation output. Solid and dotted lines represent the permuted 95% (LOD ≥ 3.9, P ≤ 0.05) and 90% (LOD ≥ 3.5, P ≤ 0.1) LOD thresholds, respectively.

