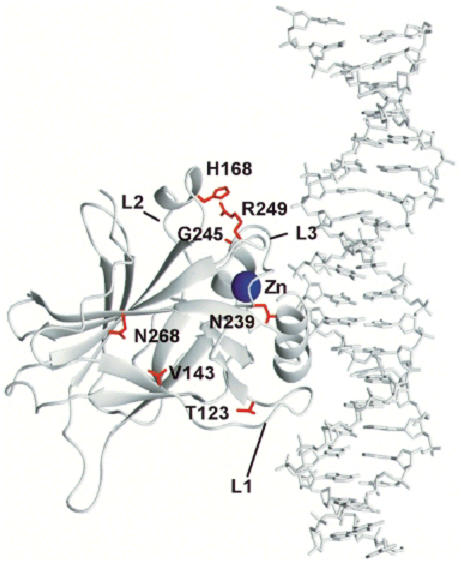
Fig. 2. Schematic model of the human p53 core domain tumour suppressor protein–DNA consensus sequence complex. The PDB (1tsr) co-ordinates were used to display only chain B of p53 (amino acids 94–312) in a complex with the DNA double helix (Cho et al., 1994). The mutated residues are shown in red and the zinc atom in blue. Figures 2 and 4 were made using the program MOLMOL (Koradi et al., 1996).

An official website of the United States government
Here's how you know
Official websites use .gov
A
.gov website belongs to an official
government organization in the United States.
Secure .gov websites use HTTPS
A lock (
) or https:// means you've safely
connected to the .gov website. Share sensitive
information only on official, secure websites.
