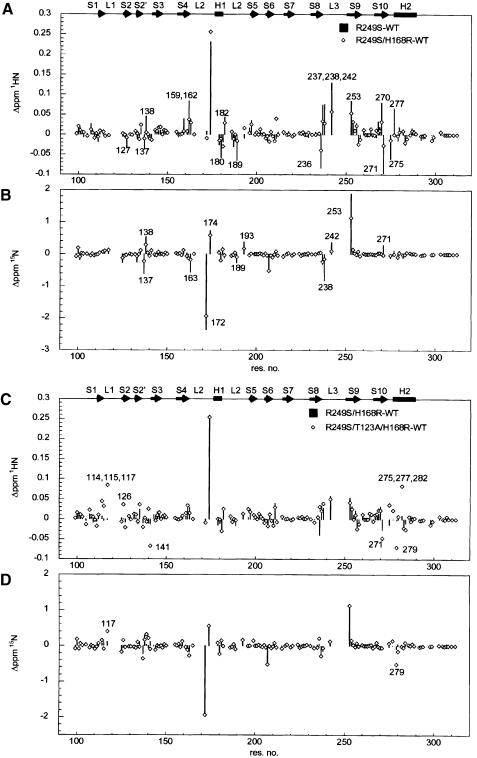
Fig. 3. Deviation of amide 1H (A, C), 15N (B, D) chemical shifts from wild-type values. (A and B) Comparison of chemical shift changes between R249S and H168R/R249S. Residues that show recovery of wild-type chemical shifts upon the H168R mutation are indicated in (A) and (B) and colour coded red in Figure 4A. (C and D) Comparison of chemical shift changes between R249S/H168R and R249S/H168R/T123A. Residues with large chemical shift changes upon the third T123A mutation are indicated in (C) and (D) and colour coded red in Figure 4B. The chemical shifts for some residues were not determined (shown as gaps between data points) due to cross-peak overlapping or insufficient sensitivity in NMR experiments.

An official website of the United States government
Here's how you know
Official websites use .gov
A
.gov website belongs to an official
government organization in the United States.
Secure .gov websites use HTTPS
A lock (
) or https:// means you've safely
connected to the .gov website. Share sensitive
information only on official, secure websites.
