Figure 3.
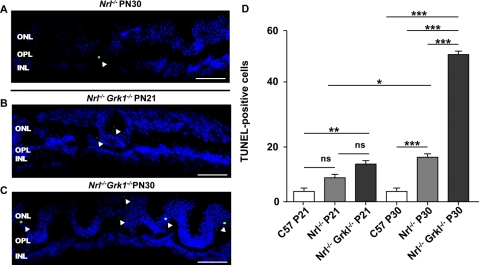
TUNEL staining is enhanced in Nrl−/−Grk1−/−. Retinal sections from (A) P30 Nrl−/−, (B) P21 Nrl−/−Grk1−/−, and (C) P30 Nrl−/−Grk1−/− mice were processed for TUNEL staining. Shown are images of the middle superior region of the retina. TUNEL-positive apoptotic cells (green) were counted under a fluorescence light microscope. The total number of TUNEL-positive cells from three sections of each mouse was recorded, and the average count (mean ± SEM) was calculated from three mice using one-way ANOVA of the same genotype (D). *P < 0.05; **P < 0.01; ***P < 0.001. Scale bar, 20 μm.

