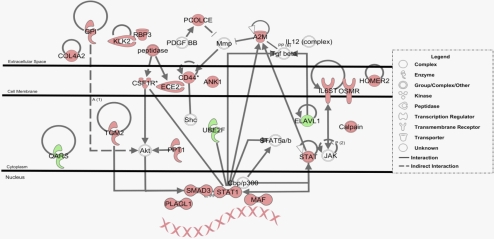
Figure 4.
Schematic representation of the inflammatory disease, inflammatory response network. Microarray data set analysis was used to generate a hypothetical network based on upregulated transcripts. Dotted lines: indirect protein relationships. Solid lines: direct relationships, including protein-protein interactions, phosphorylation, activation, and ligand receptor binding. Red molecules represent significantly upregulated transcripts. Green molecules represent downregulated transcripts. Uncolored molecules were not differentially expressed but were important components of the network.

