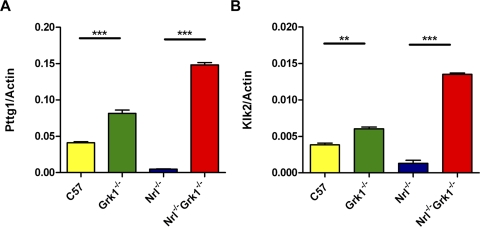
Figure 5.
Confirmation of differential mRNA expression of Klk2 and Pttg1 using quantitative RT-PCR. cDNAs from WT, Grk1−/−, Nrl−/−, and Nrl−/−Grk1−/− 1-month-old retinas were used for quantitative expression analysis, and β-actin was a reference standard. Statistically significant upregulation of (A) Pttg1 and (B) Klk2 was observed in both Grk1−/− compared with WT and Nrl−/−Grk1−/− compared with Nrl−/−. *P < 0.05; **P < 0.01.

