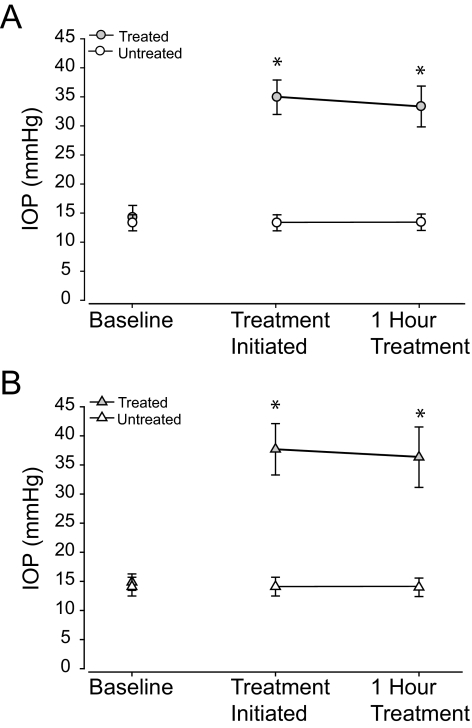
Figure 3.
(A) Mean (± SD) IOP measurements by pneumatonometer before placement of the vascular loop (baseline), immediately after placement of the vascular loop, and at the end of the 1-hour IOP pressure elevation session in the treated right eye and in the untreated left eye of all rats completing 6 weeks of daily elevated IOP. (B) Mean (± SD) IOP measurements by tonometer before placement of the vascular loop, immediately after placement of the vascular loop, and at the end of the 1-hour IOP pressure elevation session in the treated right eye and in the untreated left eye of all rats completing 6 weeks of daily elevated IOP. Asterisk: statistical significance. The IOP is elevated immediately after placement in the vascular loop around the eye.

