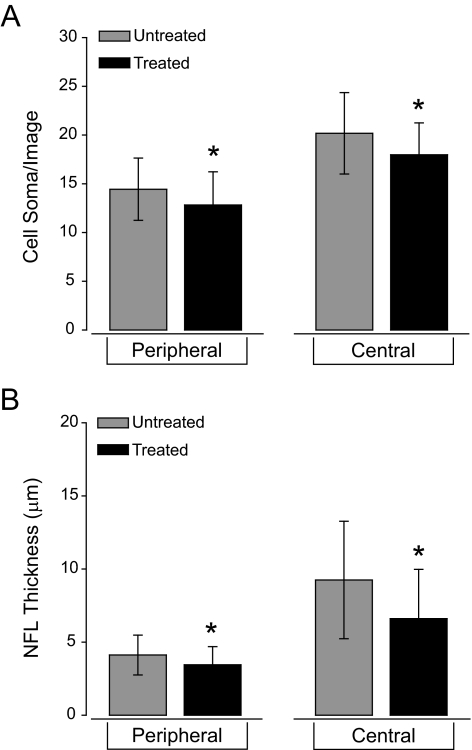
Figure 5.
Quantification of cell soma number in the ganglion cell layer (A) and nerve fiber layer thickness (B) in untreated eyes and treated eyes receiving 6 weeks of daily, 1-hour IOP elevations. (A) There are significantly fewer cells within the ganglion cell layer in treated eyes than in untreated eyes both near the optic nerve head and in the periphery (P < 0.01). (B) The retinal nerve fiber layer is significantly thinner in the treated eyes than in the untreated eyes both near the optic nerve head and in the periphery (P < 0.01). Asterisks: statistical significance.

