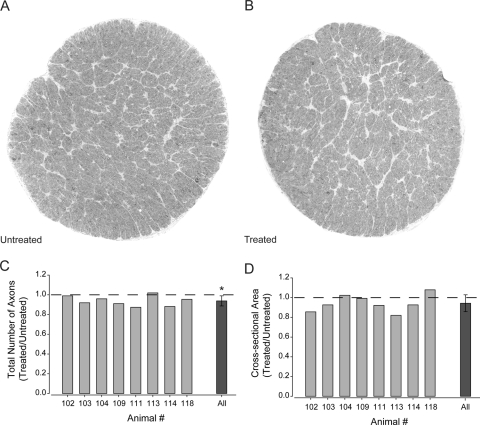
Figure 7.
Quantification of total axon number and cross-sectional area of optic nerves from untreated eyes and the contralateral 6-week treated eye. (A) Representative montage (100×) of optic nerve cross-section from contralateral untreated eye. (B) Representative montage (100×) of optic nerve cross-section from treated eye. (C) Total number of axons in an entire optic nerve cross-section represented as the ratio of axons in treated versus untreated optic nerves. Graph depicts the ratios for individual animals (light gray) and the combined ratio across all animals (dark gray). The total number of axons is significantly lower in treated nerves compared with untreated nerves (P = 0.01). (D) Cross-sectional area of entire optic nerve represented as the ratio of area in treated versus untreated optic nerves. Graph depicts the ratios for individual animals (light gray) and the combined ratio across all animals (dark gray). The cross-sectional area of the optic nerve did not differ between treated and untreated optic nerves (P = 0.10). Asterisk: statistical significance.

