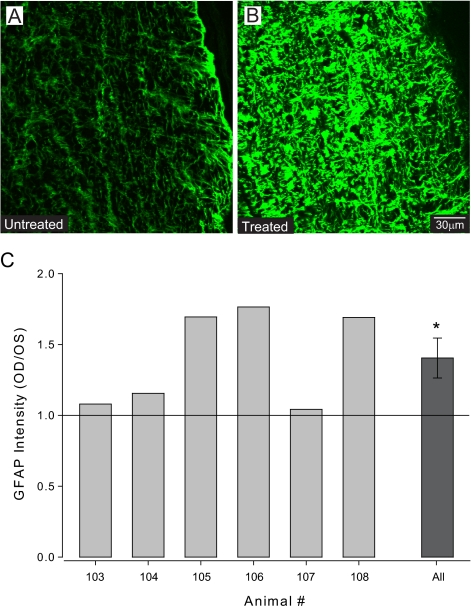
Figure 8.
(A, B) Representative semiquantitative confocal micrographs from animal 106 of longitudinal optic nerve sections immunohistochemically labeled for GFAP (green). Treated optic nerves (B) subjectively demonstrate greater intensity of GFAP labeling than untreated optic nerves (A). (C) Spectral analysis of GFAP signal intensity represented as the ratio of signal intensity in treated versus untreated optic nerves. Graph depicts the ratios for individual animals (light gray) and the combined ratio across all animals (dark gray). On average, the intensity of GFAP labeling was 36% greater in treated optic nerves compared with untreated nerves (P = 0.03). Asterisk: statistical significance.

